


Download our free guide to learn how to measure and analyze your website performance.
The email you entered is invalid.
Thank you for subscribing.
By entering your email, you indicate that you have read and understood our Privacy Policy and agree to receive marketing from Squarespace.
If you’ve built your website on Squarespace, all the tools you will need to measure the performance of your site can be found on the Squarespace analytics panel. This suite of reports can tell you who's visiting your site, the websites and keywords directing visitors to it, and how visitors engage with your content. Users who have chosen a Squarespace Business or Commerce plan also have access to reports that will track your online sales and tell you whether people are buying or clicking away.
Read on for a crash course on how to interpret and measure your site’s success with your Squarespace analytics panel.
Accessing Squarespace's analytics panel
If you have logged into Squarespace through your web browser, select the home menu and choose Analytics. If you're using the Squarespace app for iOS or Android mobile devices, open the app and click on the Analytics tab.
The panel lists dozens of metrics, organized by these categories:
Overview metrics give you big-picture glimpses at your site's traffic and sales.
Commerce (available only to users with Business and Commerce plans) drills down into your sales data.
Acquisition metrics give you information on how visitors arrive on your site.
Engagement data gives you granular traffic information on individual pages and visitors
Each of these analytics tools lets you select date ranges and examine the data for a specific day, week, month, or year.
In order to access the analytics, you must have a valid login to Squarespace, and you must be the site's owner or administrator. Members of the public, or even your staff, will never see your metrics unless you give them administrator access. Make sure to log into Squarespace every time you browse your own website—that prevents Squarespace analytics from logging your activity.
Squarespace offers several ways for you to get support with understanding analytics. You can find answers to many questions, including definitions of basic terms, in the Squarespace Help Center. You can post a specific question or search for topics that other Squarespace users have asked and answered on the Squarespace Forum. Or you could hire a vetted Squarespace expert from Squarespace Marketplace to consult on your site.
Interpreting site traffic metrics
Squarespace analytics let you see the overall picture of your site traffic, as well as focus on detailed data. Both kinds of key performance indicators (KPIs) are valuable, but you'll want to monitor most closely the KPIs that reflect your site goals.
Here are the three big-picture metrics you'll find on the traffic or traffic overview panel:
Pageviews: The number of times people have downloaded a page from your website in their browsers. Sometimes you'll hear pageviews called clicks.
Visits: The number of times readers have visited your site in the time frame you've selected. A visit can be one page or many.
Unique visitors: An estimate of how many individuals have visited your website during a given window of time. Some unique visitors may have browsed your site multiple times.
A few traffic metrics can give you more detailed information about how your site, or specific pages, are performing:
Geography: A heat map that shows you where site visits originate. Select individual regions or cities to look at the raw numbers.
Traffic sources: Where visitors to your site come from. Direct visitors have typed your URL into their browser; others arrive from search engines, social media platforms, links on other websites, or email or text messages.
Site content: KPIs for specific pages. These metrics identify the most-read pages on your site, show engagement rates (how long visitors spend on the page), and bounce rates, which indicate what percentage of visitors leave your site after browsing a given page.
Measuring ecommerce success
When you sign up for a Basic or Advanced Commerce plan, you gain access to an additional set of analytics that track ecommerce activity on your website. Just like traffic metrics, you can filter the data by time frame.
Squarespace analytics’ Sales panel includes a few top-level KPIs:
Revenue: Total amount of sales, not including taxes or shipping
Units sold: Number of specific items sold—or, if visitors can purchase access to exclusive areas of your site—how many member-access passes have been bought
Conversion rate: The proportion of visitors to your site that purchase something
AOV: Average order value, or the average amount buyers spend on your site per order
Several additional Squarespace analytics panels offer more granular information:
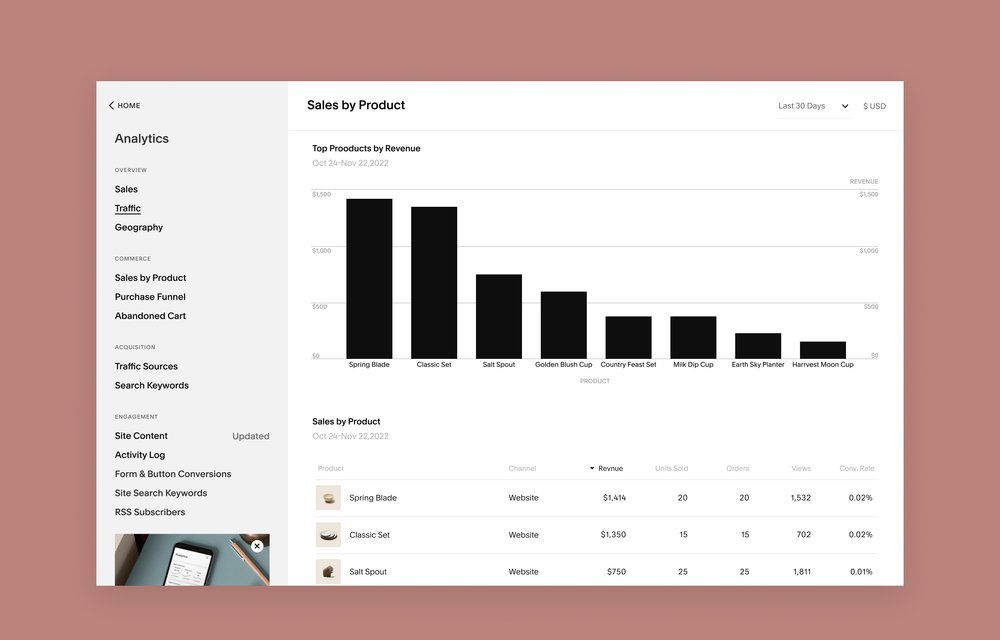
Sales by product: This panel allows you to compare the sales of all the products on your website. It also lets you study a specific product to see how many units you've sold, the total value of those sales, and the percentage of shoppers who have viewed the product and then purchased it.
Purchase funnel: By studying the KPIs on this analytics panel, you can compare the overall site traffic to the percentage of visitors who shop for specific products, add them to a checkout cart, and/or purchase them.
Form and conversion buttons: These metrics help you understand how many visitors fill out sign-up forms or click on call-to-action buttons.